Figure a blog without pictures or conversations is just boring, so, here it is.
Lately, I have been dealing a lot with data visualization. This was a brand new area for me and while we do use F# for data extraction, all of the front end is done using d3, an amazing toolkit by Mike Bostock.
First of all, I owe the fact that my projects got off the ground to Mike and Jim Vallandigham. Jim taught me all I know about how to draw bubble “charts” and use d3 force layouts. His blog is invaluable for anyone making first steps in the area of data visualization. Code snippets I am going to post here are due to Jim’s and Mike’s generosity. So, thank you Mike and Jim.
One may ask, if there are already tutorials on how to put together visuals, why assault the world with more musings (as a Candace Bushnell character once wrote). The answer is: my goal in these posts is not to exploring creation of visuals, but rather sharing experiences on how to put together projects that involve visualizations.
These are very different problems, since your task is not just to create a single document or web page for a single purpose, but to create something that can dynamically build these documents or pages, and maybe, within each such document provide different views of the same data. Questions of:
- design
- reuse
- coding practices
come up right away, not to mention general problems:
- What are data visualizations?
- What are they used for?
- Are they needed at all?
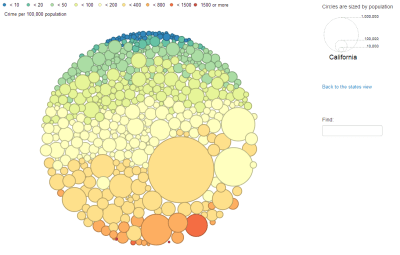
So, for these posts, we will be building a project that visualizes crime statistics in the US for the year 2008. The data source for this is found here and the complete solution will look like this.
The approximate plan for the next few posts:
- Thinking about visualizations and what they are
- Preparations
- Getting Data (retrieving, massaging, formatting)
- Getting the tools together (CofeeScript, d3, ColorBrewer, Knockout.js, Twitter Bootstrap, jQuery, jQuery bbq)
- Building the visuals
- Laying out “single” charts
- Laying out multiple charts on the same page
- A word about maps
- Lessons learned: architecting for reuse, etc

One thought on “Visualizing Crime with d3: Intro”