Previously
Generating and Visualizing Graphs
I can hardly overemphasize the importance of visusalizations. Many a bug had been immediately spotted just by looking at a visual of a complex data structure. I therefore decided to add visuals to the project as soon as the DirectedGraph class was born.
Code & Prerequisits
Code is on GitHub.
- GraphViz: install and add the bin directory to the PATH
- EmguCV v3.1: install and add the bin directory to the PATH
DrawGraph
This is a small auxiliary component I wrote to make all future visualizations possible. And here is a sidebar. I didn’t want to write this component. I am not a fan of re-writing something that was written a hundred times before me, so the first thing I did was look for something similar I could use. Sure enough, I found a few things. How can I put it? Software engineering is great, but boy, do we tend to overengineer things! I know, I’m guilty of the same thing myself. All I wanted from the library was an ability to receive a text file written in GraphViz DSL, and get on the output a .png containing the picture of the graph. Just a very simple GraphViz driver, nothing more.
One library had me instantiate 3 (three!) classes, another developed a whole API of its own to build the GraphViz file… I ended up writing my own component, it has precisely 47 lines of code. the last 4 lines are aliasing a single function that does exactly what I wanted. It creates the png file and then immediately invokes the EmguCV image viewer to show it. After we’re done, it cleans up after itself, deleting the temporary png file. Here it is.
Taking it for a Ride
Just to see this work…
Another digression. Love the new feature that generates all the “#r” instructions for F# scripts and sticks them into one file! Yes, this one! Right-click on “References” in an F# project:
 .
.
And the generated scripts auto-update as you recompile with new references! A+ for the feature, thank you so much.
Comes with a small gotcha, though: sometimes it doesn’t get the order of references quite right and then errors complaining of references not being loaded appear in the interactive. I spent quite a few painful hours wondering how is it that this reference was not loaded, when here it is! Then I realized: it was being loaded AFTER it was required by references coming after it).
#load "load-project-release.fsx"
open DrawGraph

createGraph "digraph{a->b; b->c; 2->1; d->b; b->b; a->d}" "dot.exe" None
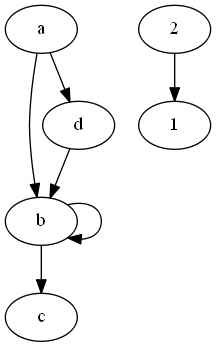
Cool. Now I can take this and use my own function to generate a graph from a string adjacency list, visualize it, and even view some of its properties. Sort of make the graph “palpable”:
let sparse = ["a -> b, c, d"; "b -> a, c"; "d -> e, f"; "e -> f"; "1 -> 2, 3"; "3 -> 4, 5"; "x -> y, z"; "2 -> 5"]
let grs = StrGraph.FromStrings sparse

grs.Visualize(clusters = true)
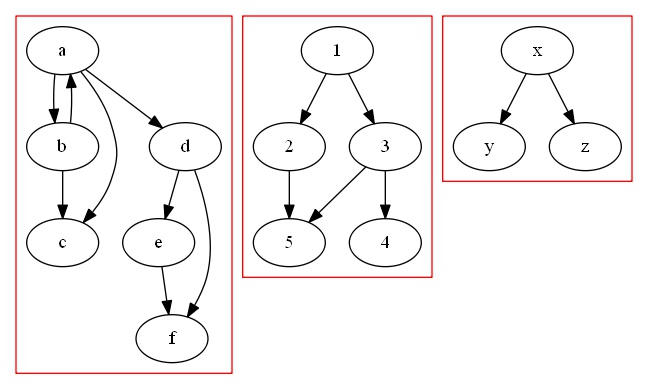
StrGraph.FromStrings does exactly what it says: it generates a graph from a sequence of strings, formatted like the sparse list above.
My Visualize function is a kitchen sink for all kinds of visuals, driven by its parameters. In the above example, it invokes graph partitioning to clearly mark connected components.
It is important to note, that this functionality was added to the visualizer not because I wanted to see connected components more clearly, but as a quick way to ensure that my partitioning implementation was indeed working correctly.
Generating Data and Looking at It
Now we have a class that builds graphs and even lets us look at them, so where do we get these graphs? The easiest thing (seemed at the time) was to create them.
Enter FsCheck. It’s not the easiest library to use, there is a learning curve and getting used to things takes time, but it’s very helpful. Their documentation is quite good too. The idea is to write a generator for your type and then use that generator to create as many samples as you like:
#load "load-project-release.fsx"

open Graphs
open FsCheck
open System
open DataGen

let grGen = graphGen 3 50
let gr = grGen.Sample(15, 5).[2]

gr.Visualize(into=3, out= 3)
This produces something like:

My function graphGen len num generates a graph of text vertices where len is the length of a vertex name and num is the number of vertices. It returns an FsCheck generator that can then be sampled to get actual graphs. This was a one-off kind of experiment, so it’s in a completely separate module:
//DataGen.fs

module DataGen
open FsCheck
open System
open Graphs

let nucl = Gen.choose(int 'A', int 'Z') |> Gen.map char

let genVertex len =  Gen.arrayOfLength len nucl |> Gen.map (fun c -> String(c))
let vertices len number = Gen.arrayOfLength number (genVertex len) |> Gen.map Array.distinct

let graphGen len number =
    let verts = vertices len number
    let rnd = Random(int DateTime.UtcNow.Ticks)
    let pickFrom = verts |> Gen.map (fun lst -> lst.[rnd.Next(lst.Length)])
    let pickTo = Gen.sized (fun n -> Gen.listOfLength (if n = 0 then 1 else n) pickFrom)

    Gen.sized
    <|
    (fun n ->
        Gen.map2
            (fun from to' ->
                from, (to' |> Seq.reduce (fun acc v -> acc + ", " + v))) pickFrom pickTo
        |>
        Gen.arrayOfLength (if n = 0 then 1 else n)
        |> Gen.map (Array.distinctBy fst)
        |> Gen.map (fun arr ->  arr |> Array.map (fun (a, b) -> a + " -> " + b))
    )
    |> Gen.map StrGraph.FromStrings
This whole module cascades different FsCheck generators to create a random graph.
The simplest of them nucl, generates a random character. (Its name comes from the fact that originally I wanted to limit the alphabet to just four nucleotide characters A, C, G, T). Then this generator is used by genVertex to generate a random string vertex, and finally vertices creates an array of distinct random vertices.
graphGen creates a sequence of strings that FromStrings (above) understands. It first creates a string of “inbound” vertices and then adds an outbound vertex to each such string.
Sampling is a little tricky, for instance, the first parameter to the Sample function, which, per documentation, controls sample size, in this case is responsible for complexity and connectivity of the resulting graphs.
On to Euler…
The script above also specifies a couple of optional parameters to the visualizer: into will mark any vertex that has into or more inbound connections in green. And out will do the same for outbound connections and yellow. If the same vertex possesses both properties, it turns blue.
Inspired by all this success, I now want to write a function that would generate Eulerian graphs. The famous theorem states that being Eulerian (having an Euler cycle) for a directed graph is equivalent to being strongly connected and having in-degree of each vertex equal to its out-degree. Thus, the above properties of the visualizer are quite helpful in confirming that the brand new generator I have written for Eulerain graphs (GenerateEulerGraph) is at the very least on track:
let gre = StrGraph.GenerateEulerGraph(10, 5)
gre.Visualize(into=3, out=3)
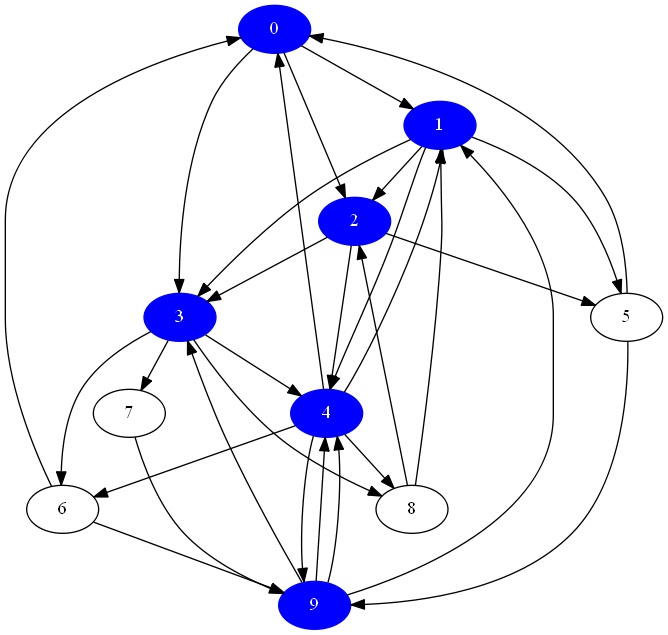
Very encouraging! Whatever has at least 3 edges out, has at least 3 edges in. Not a definitive test, but the necessary condition of having only blue and transparent vertices in the case of an Eulerian graph is satisfied.
In the next post – more about Eulerian graphs, de Brujin sequences, building (and visualizing!) de Bruijn graphs, used for DNA sequence assembly.

One thought on “Visualizing Graphs”